Page 33 - Value_Of_Print
P. 33
The Value of
PRINT
By the Numbers
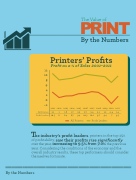
Printers’ Proits
Proit as a % of Sales 2001–2011
12
10
8
6 Printer’s Proits
4
2 CHART
0
–2
2001 2002 2003 2004 2005 2006 2007 2008 2009 2010 2011
All Printers 3.1 1 1.6 1.7 2.5 2.7 3.4 3.1 1.5 –1.4 1.4
Proit Leaders
10.5 8 8.4 8.7 9.4 10.3
10.1 9.7 9.4 7 9.5
All Printers
Proit Leaders
T
he industry’s proit leaders, printers in the top 25%
saw their proits rise signiicantly
of proitability,
increasing to 9.5% from 7.0%
over the year, the previous
year. Considering the conditions of the economy and the
overall industry results, these top performers should consider
themselves fortunate.
By the Numbers
By the Numbers
VPflipbook_cobrand_Final for print CS4.indd 59 6/13/12 2:19 PM